Evolution of the National Lottery – the first 20 years: part 1
The National Lottery has come a long way since it began as a single Online Game on 19 November 1994. Over time, Camelot has introduced initiatives to add more varied games, broaden the base of players, grow sales and increase the revenue of Good Causes.

The first part of this article focuses on the first twenty years and examines
- the background,
- how prizes are funded through sales,
- some early history and
- the financial impact of the National Lottery.
Table of contents
Estimated reading time: 16 minutes
Background
The Early Years
The National Lottery began with a single game, known originally as the Online Game. Later, in 2002, it was renamed Lotto.
The basic unit of play was called a board, costing £1, and consisted of six unique numbers chosen from 49.
In each drawing, the pattern remained the same. A mechanism withdrew seven agitated balls from a drum in full view of a TV audience – the first six comprised the main balls, and the seventh, the bonus ball.
There was a simple prize structure of five prize tiers, ranging from a guaranteed minimum of £10 to a million pounds or more, usually. Matching five main balls and the bonus paid a handsome prize of around £100,000. The exact amounts of four of the five prize tiers depended on a set proportion of the ticket sales. i.e. the prizes were pari-mutuel.
The first 4 draws
The tables below show the details of the prize structure for the first four draws.
| Prize Tier | Winners | Prize |
|---|---|---|
| Match 3 | 1,073,695 | £10 |
| Match 4 | 76,731 | £32 |
| Match 5 | 2,139 | £528 |
| Match 5+ | 39 | £46,349 |
| Match 6 | 7 | £839,254 |
| Total: | 1,152,611 | |
| Balls: 3, 5, 14, 22, 30, 44, bonus 10 | ||
| Sales: £48,965,792 | Success rate: 2.35% | |
| Prize Tier | Winners | Prize |
|---|---|---|
| Match 3 | 843,672 | £10 |
| Match 4 | 43,792 | £66 |
| Match 5 | 693 | £1,916 |
| Match 5+ | 8 | £265,637 |
| Match 6 | 0 | £6,906,572 |
| Total: | 888,165 | |
| Balls: 11, 17, 21, 29, 30, 40, bonus 31 | ||
| Sales: £48,263,533 | Success rate: 1.84% | |
| Prize Tier | Winners | Prize |
|---|---|---|
| Match 3 | 802,871 | £10 |
| Match 4 | 40,072 | £74 |
| Match 5 | 649 | £2,087 |
| Match 5+ | 10 | £216,734 |
| Match 6 | 4 | £1,760,966 |
| Total: | 843,806 | |
| Balls: 6, 12, 15, 16, 31, 44, bonus 37 | ||
| Sales: £47,943,564 | Success rate: 1.76% | |
| Prize Tier | Winners | Prize |
|---|---|---|
| Match 3 | 657,025 | £10 |
| Match 4 | 28,244 | £164 |
| Match 5 | 473 | £4,461 |
| Match 5+ | 10 | £337,644 |
| Match 6 | 1 | £17,880,003[2] |
| Total: | 685,753 | |
| Balls: 26, 35, 38, 43, 47, 49, bonus 28 | ||
| Sales: £61,495,564 | Success rate: 1.12% | |
Interestingly:
- There were no millionaires in the first draw;
- The prizes vary considerably;
- No one won the jackpot prize of £6,906,572 in draw 3;
- The rollover jackpot in draw 4 was huge, standing at nearly £18 million with a single winner, and the balls drawn were in the upper half of the range (i.e. 26 to 49);
- Sales on the rollover draw were much higher than before;
- Lower success rates[3] bump up the prizes.
Sales before the introduction of Lucky Dips
The game caught the imagination of the playing public, who played consistently overall, as shown in the figure below. Lucky Dips became available at the end of the period depicted.

Features of the bar chart
- Once established in the public’s gaze, you can see an average sales volume of about £64 million per draw.
- Large spikes show that sales increased noticeably for some draws.
- The jackpots of draws 9, 20, 24, 28, 30, 34, 40, 44, 59, 60, 62 and 63 were spikes. Looking at the accompanying data, they had been boosted by carrying over the previous jackpot, which no one had won, meaning they were rollover jackpots.
- Draws 60 and 63 were double rollovers. i.e. a rollover followed immediately by another.
- Draw 17 was a particular case. It was a Superdraw, meaning that Camelot had increased the jackpot by £4 million, unrelated to sales, to stimulate interest.
- Typically, sales fall back to their average level after someone wins the jackpot. However, beyond draws 60 and 63, the baseline level rose temporarily to about £75 million, supporting the view that large sales chase bumper jackpots.
Big jackpots increase ticket sales markedly; conversely, bumper sales raise jackpots.
Ticket sales fund prizes
Lotto is based on a betting system known as a pari-mutuel, in which winners receive a proportion of the total money staked after deducting management and other charges, such as tax. The prizes depend on the amount of money raised by the sale of tickets for each draw.
Prize Fund
| Period | Before New Dawn[4] | After New Dawn[5] | ||
|---|---|---|---|---|
| Allocated to: | % | Amount | % | Amount |
| Lotto Prizes | 45% | 45p | 47.5%[6] | 95p |
| Good Causes | 28% | 28p | 28% | 56p |
| Lottery Duty to Exchequer | 12% | 12p | 12% | 24p |
| Commission to Retailers | 5% | 5p | 5% | 10p |
| Operating costs | 4.5% | 4.5p | ~ 4% | ~ 8p |
| Operator’s profits | 0.5% | 0.5p | 0.3% to 0.5%[7] | 0.6p to 1p |
| Retained for other uses | 5% | 5p | ~ 3% | ~ 6p |
| Total: | 100% | £1.00 | 100% | £2.00[8] |
After deducting the amount for Good Causes, retailers’ commission, management charges and lottery duty, the pool of money is split into several prize-winning categories – Match 3, Match 4, Match 5, etc. The more the stake money, the higher is the total prize fund.
Example – Draw 4 held on Saturday, 10 December 1994
Ticket sales totalled £61,495,564 for draw 4, held on Saturday, 10 December 1994.
Match 3 prizes had the first call on the prize fund; 657,025,259 boards won £10.
Before calculating the prize tiers, here are the steps to work out the Net Prize Fund.
- Prize Fund = 45% of sales (i.e. 0.45 × £61,495,564)
∴ Prize Fund = £27,673,003 - Prize Fund = (£27,673,003 − £6,570,250), deduct £10 prizes
- Net Prize Fund = £21,102,753
| Pool | % | Size | ÷ | Winners | Prize |
|---|---|---|---|---|---|
| Match 4 | 22% | £4,642,605 | ÷ | 28,244 | £164 |
| Match 5 | 10% | £2,110,275 | ÷ | 473 | £4,461 |
| Match 5+ | 16% | £3,376,440 | ÷ | 10 | £337,644 |
| Match 6 | 52% | £10,973,431 | |||
| Add Rollover | + £6,906,572 | ||||
| Match 6 (total) | £17,880,003 | ÷ | 1 | £17,880,003 |
The prize structure remained constant for nearly 19 years, based upon a price of £1 per board. It changed when Camelot announced the New Dawn for Lotto to reinvigorate the game.
The price of each board rose from £1 to £2, and the prize structure was altered to add raffle prizes of £20,000. The changes took effect from 5 October 2013 – draw 1856.
Anomalies
Occasionally, something extraordinary happens; the usual pattern is broken. The National Lottery is no exception.
Consider two examples, one of which occurred after twenty years but which I include since it illustrates how lotteries behave rarely. Just because an event seems highly unlikely does not mean it won’t happen. Sometimes, it does thwart our usual expectations.
| Prize Tier | Winners | Prize |
|---|---|---|
| Match 3 | 1,932,744 | £10 |
| Match 4 | 165,738 | £16 |
| Match 5 | 6,660 | £181 |
| Match 5+ | 246 | £7,872 |
| Match 6 | 133 | £122,510 |
| Total: | 2,105,521 | |
| Balls: 7, 17, 23, 32, 38, 42, bonus 48 | ||
| Sales: £69,846,979 | Success rate: 3.01% | |
No one had won the £10 million jackpot in the previous draw, the first guaranteed Superdraw, so it was carried over to this draw, giving an accumulated jackpot of £16,293,830.
There were many winners in the Match 6 category, producing the smallest jackpot to date, prompting fears that a large syndicate might have been in operation, but these fears proved unfounded.
The regular way the winning numbers appeared on the play slip suggested a more likely explanation for the large number of winners in all categories.

| Prize Tier | Winners | Prize |
|---|---|---|
| Match 2 | 938,938 | Free Lucky Dip |
| Match 3 | 114,232 | £25 |
| Match 4 | 7,879 | £51 |
| Match 5 | 4,082 | £15 |
| Match 5+ | 6 | £10,016 |
| Match 6 | 0 | £24,887,143 |
| Raffle – upper tier | 1 | £1,000,000 |
| Raffle – lower tier | 20 | £20,000 |
| Total: | 126,199 | |
| Balls: 7, 14, 21, 35, 41, 42, bonus 43 | ||
| Sales: £17,749,682 (estimated) | ||
| Boards: 8,874,841 | Success rate: 1.42% | |
By draw 2113, Lotto had been enhanced to play with 59 balls instead of 49. The game changed its prize structure, adding the Match 2 prize tier and raffles.
Interestingly, five of the six main balls drawn were multiples of 7.
Seven is considered a lucky number in Western culture, so it is hardly surprising that there were far more than usual winners in the Match 5 category. i.e. by two orders of magnitude (102 = 100) or thereabouts.
The National Lottery comes of age
After the first weekly draw on Saturday, 19 November 1994, it soon became clear that the National Lottery was a resounding success, but not without controversy, as ticket sales and jackpots greatly exceeded expectations.
Inevitably, Camelot came under pressure to raise more money for Good Causes. The company responded by introducing new games to diversify its portfolio and attract new players. e.g. Thunderball and the Big Draws at New Year.
However, despite its efforts, total sales peaked and began to fall. The National Lottery’s opponents and critics were quick to point out these shortcomings. Criticism was often fierce[9]. Sometimes, it was unjust, especially where it concerned the distribution of funds to Good Causes over which Camelot had no control.
Early Sales
| Year | Lotto | Extra | Hotpicks | Thunderball | Big Draws | Annual Sales |
|---|---|---|---|---|---|---|
| 1994 | £369,869,842 | – | – | – | – | £369,869,842 |
| 1995 | £3,426,908,586 | – | – | – | – | £3,426,908,586 |
| 1996 | £3,805,189,028 | – | – | – | – | £3,805,189,028 |
| 1997 | £4,644,609,909 | – | – | – | – | £4,644,609,909 |
| 1998 | £4,592,204,889 | – | – | – | – | £4,592,204,889 |
| 1999 | £4,243,953,655 | – | – | £137,447,149 | £80,601,805 | £4,462,002,609 |
| 2000 | £4,264,235,970 | £19,361,057 | – | £239,083,818 | £24,739,425 | £4,547,420,270 |
| 2001 | £3,860,773,670 | £126,990,112 | – | £234,619,053 | £37,732,170 | £4,260,115,005 |
| 2002 | £3,555,048,181 | £96,638,016 | £150,733,888 | £233,535,841 | £24,782,200 | £4,060,738,126 |
| 2003 | £1,668,248,434 | £43,329,468 | £137,575,142 | £208,632,808 | – | £2,057,785,852 |
| £34,431,042,164 | £286,318,653 | £288,309,030 | £1,053,318,669 | £167,855,600 | £36,226,844,116 |
When you examine the sales closely, you wonder whether Camelot had been too sensitive to criticism and overreacted. The sales look good to me, but I am not an accountant!
- Jackpots became less impressive after introducing Lucky Dips to deflect criticism from colossal prizes. Recall that Lucky Dips are random choices made by a computer and are not prone to the unconscious personal biases of players. e.g. birthdays. As we have seen, high jackpots lead to higher sales and vice versa. Had Lucky Dips been a mistake? After all, the optional, jackpot-only game of Lotto Extra offered potentially higher jackpots for a small supplementary fee.
- Perhaps the euphoria subsided when it dawned on many players that they had been too wildly overoptimistic about their chances of winning a fortune. Had a sense of reality overcome enthusiasm to cause some to stop playing in frustration?
- Had the new games detracted from Lotto by shifting focus away too much?
Sales blackout
In 2003, Camelot decided abruptly not to publish sales of its games and refused adamantly to reinstate them.
No sales have been published since 9 July 2003. However, it is often possible to derive reasonable and reliable estimates.
Sales estimates are needed to calculate success rates (aka hit rates).
A national operation
Organising and operating games nationally that offer life-changing prizes regularly is no small matter. Growing or maintaining momentum that keeps the public’s support, participation, and goodwill takes time and effort.
While the draws are made mechanically, a computer system, with a national network of dedicated terminals connected to it, accepts and records the bets and issues tickets. Millions of pounds have been spent building and enhancing the lottery infrastructure.
Thousands of retail outlets, such as corner shops, newsagents, post offices, convenience stores and supermarkets, sell lottery tickets. Over the years, players have handed billions of pounds in banknotes and small change over the counter to pursue their dream of achieving financial independence and security.

While many play, few win life-changing sums. Most people come away with nothing or win minor consolation prizes; that is how lotteries work. The odds against winning a jackpot are formidable, but a substantial small minority wins nevertheless.
Beneficial outcomes
Like it or loathe it, the National Lottery has created hundreds of millionaires overnight and provided billions of pounds to charitable, good causes that would not otherwise have received such bounty.
Through footfall, the lottery has saved many newsagents, corner shops and convenience stores, encouraging them to stay open outside regular hours and enlivening communities.
Also, the National Lottery contributed £2.2 billion towards the London 2012 Olympic and Paralympic Games, and lots of local projects, big and small, have benefited from lottery grants year in and year out. Considerable wealth has been redistributed.
A period of change
Many social, economic, political and technological changes have occurred since the National Lottery began.
They include
- Wars in Iraq and Afghanistan,
- Acts of terrorism such as 9/11,
- Financial upheaval,
- Banking crises,
- Recession,
- Cuts in government spending,
- High immigration,
- Outsourcing work overseas,
- Less secure employment, underemployment and unemployment,
- Globalisation,
- and the re-balancing of the economy away from the traditional, heavy “smokestack” industries.
They might have militated against spending on Good Causes and been detrimental to the average household budget. Nevertheless, the National Lottery has ensured that there has been financial support for Good Causes throughout. I believe credit is due to Camelot for sustaining the National Lottery successfully since 1994 – a formidable achievement.
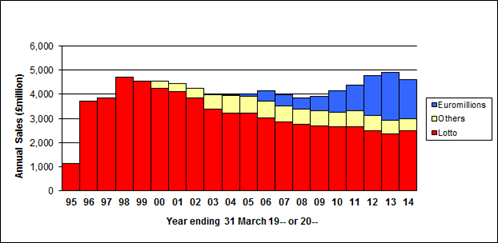
Sales recovered over time
On reflection, Camelot overreacted to falling sales in 2003.
To support my view, I have produced a bar chart of sales spanning 20 years. I used a combination of previously published data, sales estimates (a mixture of mine and Merseyworld‘s[10]), and figures published by Camelot and the lottery regulator in their annual reports.
See what you think, but be aware that the figures relate to financial years ending on 31 March rather than calendar years, which means that the numbers on the graph below will not match those in the table of Early Sales[11] exactly.
The financial impact of the National Lottery
The following table[12], spanning eight years, shows how much money the National Lottery turned over from sales of its entire portfolio of games. You can see which games were operating concurrently over any financial year from the infographic at the head of this article.
The average was about £112 million per week, which raised nearly £31 million per week for Good Causes. Also, the average weekly contribution from draw-based games was approximately £83 million, with Lotto accounting for almost 61% of the income (~£50 million per week).
Although it was still the flagship game, the proportion of Lotto sales dropped from 72% at the start to 54% of draw-based sales at the end.
| Category | Year ended 31 March | Over 8 years | |||||||
|---|---|---|---|---|---|---|---|---|---|
| 2007 | 2008 | 2009 | 2010 | 2011 | 2012 | 2013 | 2014 | ||
| (£million) | (£million) | (£million) | (£million) | (£million) | (£million) | (£million) | (£million) | (£million) | |
| Sales of draw-based games | £3,983.5 | £3,856.7 | £3,928.0 | £4,121.6 | £4,386.3 | £4,800.1 | £4,915.9 | £4,589.8 | £34,581.9 |
| Sales of Scratchcards/IWG[13] | £927.9 | £1,109.6 | £1,221.1 | £1,330.2 | £1,436.1 | £1,725.8 | £2,062.0 | £2,141.1 | £11,953.8 |
| Total Sales | £4,911.4 | £4,966.3 | £5,149.1 | £5,451.8 | £5,822.4 | £6,525.9 | £6,977.9 | £6,730.9 | £46,535.7 |
| Good Causes[14] (a) | £1,335.5 | £1,351.8 | £1,377.6 | £1,548.4 | £1,665.1 | £1,825.1 | £1,951.4 | £1,751.0 | £12,805.9 |
| Lottery Duty (b) | £589.8 | £596.0 | £617.9 | £654.3 | £698.7 | £783.1 | £837.3 | £808.4 | £5,585.5 |
| Retailers’ Commission (c) | £244.5 | £243.5 | £247.7 | £261.7 | £275.0 | £301.4 | £321.3 | £304.6 | £2,199.7 |
| Sub-total (a + b +c) | £2,169.8 | £2,191.3 | £2,243.2 | £2,464.4 | £2,638.8 | £2,909.6 | £3,110.0 | £2,864.0 | £20,591.1 |
| Prizes | £2,490.7 | £2,516.8 | £2,627.6 | £2,788.8 | £2,977.7 | £3,388.6 | £3,697.6 | £3,636.6 | £24,124.4 |
| Total | £4,660.5 | £4,708.1 | £4,870.8 | £5,253.2 | £5,616.5 | £6,298.2 | £6,807.6 | £6,500.6 | £44,715.5 |
| Weekly redistribution | £89.6 | £90.5 | £93.7 | £101.0 | £108.0 | £121.1 | £130.9 | £125.0 | £107.5 |
Suppose you include
- the prizes (that create new millionaires),
- the commission to retailers (helping thousands of small, local businesses) and
- Lottery Duty (contributing to general taxation).
In that case, it becomes clear that the National Lottery has had a considerable impact, redistributing £107.5 million per week on average over the eight years. To put this into perspective financially, Stockport Metropolitan Borough Council planned to collect £142 million in Council Tax in 2014/15.
What’s next?
In the second part of this article, I describe the steps Camelot took to grow and develop the games of the National Lottery. It was a process of evolution – there were successes and failures. Some games succeeded while others did not.
Read: Part 2 of the Evolution of the National Lottery – the first 20 years.
Notes
- [1] The figure does not include Big Draw 2000 and 2001, and Christmas Millionaire Makers 2001, 2002 and 2003. They occurred at New Year’s and Christmas and would not appear on the figure at the resolution used.
- [2] In the first few weeks, sales exceeded all expectations with dramatic consequences for the jackpot. One lucky winner scooped a prize of nearly £18 million on the fourth draw, causing consternation in some quarters.
An article on the Daily Mail’s website, Mail Online, tells his salutary tale.
Many people were astonished. Some leading figures were appalled, considering it immoral that a few people could become so wealthy by chance without working for it, contrary to the Protestant work ethic. There were calls to cap the jackpot and revise the prize structure, which Camelot resisted. Lucky Dips would remedy the problem instead. - [3] Success Rate = (Total number of Winners ÷ Sales) × 100%
- [4] Draws 1 to 1855 – Saturday, 19 November 1994 to Wednesday, 2 October 2013.
- [5] Draws 1856 to 2065 – Saturday, 5 October 2013 to Wednesday, 7 October 2015.
- [6] Beginning with draw 1856 on 5 October 2013, the New Dawn introduced a new prize structure for Lotto with additional raffle prizes of £20,000; Camelot dropped them later.
42.47% of the prize fund was allocated to Lotto prizes after the New Dawn, and 5.03% to the new Lotto Raffle. - [7] The operator’s profit depended up on the amount raised for Good Causes, and was capped at 0.5% maximum (i.e. 1p per board).
- [8] The cost per board doubled to £2 at the start of the New Dawn to fund the Raffle, and the Match 3 prize rose from £10 to £25.
- [9]The National Lottery and its operator, Camelot, were not immune from criticism and scandal. In the run-up to issuing a second licence to operate the National Lottery, there was a scandal involving the regulator OFLOT. As a result, the National Lottery Commission replaced OFLOT.
That controversy was hardly surprising, given that the National Lottery was a big undertaking, flush with cash. e.g. large jackpots, causes of doubtful value in the court of public opinion, and seemingly fat cat salaries and large profits. Thankfully, these problems were resolved swiftly for the benefit of the National Lottery – for players and the institution alike. - [10] Merseyworld is highly respected and authoritative unofficial UK lottery website that contains a treasure trove of historic lottery data.
- [11] The table of Early Sales covers the calendar years 1994 to 2003. i.e. 1 January to 31 December.
- [12] The table has been compiled using data from Camelot and the National Lottery Commission reports. I collected this data between 2007 and 2014.
- [13] IWG is an acronym for Instant Win Games.
- [14] Good Causes receive prizes that remain unclaimed once 180 days have elapsed since the draw took place.
Revision date: 29 November 2024